All 14 Features
Every feature in Dashboard is built for daily maritime work — simple to use, fast to navigate, and fully integrated with the rest of Navatom.
83 Pre-Built Widget Catalog

Access a library of 83 pre-built widgets covering 27+ integrated modules across your entire fleet operation. From PMS work order counts and inventory stock levels to safety incident tracking and financial summaries, every critical metric is available as a ready-to-use widget — no configuration or custom development required.
Widgets are organized by module: 8 for Planned Maintenance, 8 for Bookkeeping, 7 for Spare Parts, 6 each for Inventory Management, Deficiencies, Non-Conformities, Accidents, Near Misses, and Technical Findings, 5 each for Drydock, Forms, and Audits, 4 each for Certificates and Circulars, 3 for Manuals, 2 for Crew Manager, and 1 for Enquiries. Every module your fleet uses feeds directly into the dashboard.
- 83 widgets across 27+ modules
- PMS, Safety, Finance, Crew & more
- Zero-configuration setup
- Module-organized widget library
- Instant access to every fleet KPI
Three Widget Display Types

Every widget renders in one of three display types optimized for its data: Metric widgets show single-value KPIs with bold numbers and trend indicators — perfect for overdue counts, completion rates, and fleet totals. Table widgets present tabular data with sortable columns and pagination — ideal for listing open work orders, pending approvals, or expiring certificates.
Chart widgets visualize data as bar charts, line charts, pie charts, and other visual formats — turning raw numbers into actionable patterns. The three-type system ensures that every piece of fleet data is presented in the most effective format for quick comprehension and decision-making.
- Metric cards for single-value KPIs
- Table widgets for tabular data
- Chart widgets for visual analytics
- Automatic format selection per widget
Drag-and-Drop Dashboard Builder

Build your perfect dashboard layout with an intuitive drag-and-drop interface powered by react-grid-layout. Pick widgets from the catalog, drag them onto your dashboard canvas, and arrange them in any configuration.
Resize widgets by dragging corner handles to give more space to critical KPIs and compact secondary metrics.
The responsive layout engine automatically adapts to different screen sizes with configurable breakpoints. Dashboards built on a desktop monitor reflow intelligently on tablets and smaller screens.
Grid snapping ensures clean alignment, and collision detection prevents widget overlap — every layout looks professional without manual pixel-pushing.
- react-grid-layout powered canvas
- Drag, drop & resize widgets freely
- Responsive breakpoint adaptation
- Grid snapping & collision detection
- Clean layouts on any screen size
Custom Dashboard Creation

Create unlimited custom dashboards with full CRUD operations — create new dashboards, copy existing ones as a starting point, edit titles and descriptions, and delete dashboards you no longer need. Each dashboard is an independent canvas with its own widget selection, layout, and sharing settings.
Copy an existing dashboard to quickly spin up a variant — take a fleet superintendent's overview dashboard and adapt it for a port captain by swapping a few widgets. The copy operation preserves the full layout and widget configuration, saving setup time when creating role-specific views.
- Unlimited custom dashboards
- Full CRUD — create, copy, edit, delete
- Copy existing dashboards as templates
- Independent widget & layout per dashboard
Five Sharing & Visibility Levels

Control exactly who can see each dashboard with five sharing and visibility levels. User Private keeps a dashboard visible only to its creator.
User Shared lets you share with selected colleagues. User Public makes a dashboard visible to everyone in your company — ideal for fleet-wide KPI boards displayed on office monitors.
Control Panel Private and Control Panel Shared are administrator-managed levels for Navatom-curated dashboards distributed to customers. These levels enable fleet management companies to push standardized dashboards to all vessels and offices, ensuring consistent KPI monitoring across the organization without requiring each user to build their own views.
- User Private — creator-only access
- User Shared — selected colleagues
- User Public — company-wide visibility
- Control Panel Private & Shared
- Granular distribution control
Fleet & Vessel Scoping

Toggle between fleet-wide aggregate views and single-vessel detail views on any dashboard. Fleet scoping aggregates widget data across all vessels in your managed fleet — total overdue maintenance items, combined safety incident counts, fleet-wide certificate expiration summaries. Vessel scoping drills down to a single ship for focused operational review.
Ship-level filtering lets the Captain or Chief Engineer see only their vessel's data on the same dashboard layout that shore management uses for the full fleet. The same widgets, the same layout, the same KPI definitions — just scoped to the relevant context. Switch between fleet and vessel views instantly without rebuilding your dashboard.
- Fleet-wide aggregate view
- Single-vessel drill-down
- Instant scope toggle
- Same layout, different data context
- Captain-to-superintendent flexibility
Three Environment Contexts

Dashboards adapt to three operating environments: Company for shore-side fleet management, Ship for vessel-based crew access, and Third Party for external stakeholders like charterers, classification societies, or port state control interfaces. Each environment context determines which widgets are available and what data scope is applied.
Shore-side Company dashboards show fleet-wide aggregations, multi-ship comparisons, and management-level KPIs. Ship dashboards focus on the individual vessel's operational data — maintenance due, inventory levels, certificate status.
Third Party dashboards provide controlled external visibility into selected fleet metrics without exposing internal operational details.
- Company — shore-side management
- Ship — vessel crew access
- Third Party — external stakeholders
- Context-aware widget availability
Default Dashboard Selection

Set any dashboard as your default — the view that loads automatically when you open the Dashboard module. Each user can designate a different default dashboard per environment context, so your shore-side landing page differs from your vessel-side landing page. The default selection is personal and does not affect other users.
For new users or roles without a custom setup, administrators can assign Control Panel dashboards as organizational defaults. New crew members joining a vessel immediately see a curated, role-appropriate dashboard without any setup, reducing onboarding friction and ensuring immediate access to critical operational data.
- Per-user default dashboard
- Per-environment context defaults
- Admin-assigned organizational defaults
- Zero-setup onboarding for new users
Module-Specific Widget Controllers

27 dedicated widget controllers — one per integrated module — handle data retrieval, aggregation, and formatting for every widget in the catalog. Each controller understands the domain model of its module: the PMS controller knows about work order statuses and maintenance intervals, the Safety controller knows about incident categories and severity levels, the Finance controller knows about budget periods and cost centers.
This modular architecture means widget data is always accurate and domain-aware. Controllers apply the correct business logic, status mappings, and aggregation rules for their module.
When a module adds new features or data fields, its widget controller extends naturally without affecting the rest of the dashboard system.
- 27 dedicated controllers
- One controller per integrated module
- Domain-aware data retrieval
- Correct business logic per module
- Extensible as modules grow
Real-Time Data Aggregation

Widget handlers query live MongoDB data with every dashboard load, ensuring you always see current operational status — not stale cached reports. When a maintenance work order is completed, an incident is reported, or a certificate expires, the dashboard reflects the change immediately.
Permission-aware data pipelines ensure users only see data they are authorized to access. Widget handlers enforce the same role-based access controls as the underlying modules — a Chief Engineer sees maintenance and technical data, while a DPA sees safety and compliance metrics. The dashboard never exposes data beyond a user's module-level permissions.
- Live MongoDB queries on every load
- No stale cached reports
- Immediate change reflection
- Permission-aware data pipelines
- Role-based access enforcement
Multi-Ship Count Aggregations

Specialized DTOs — CountByShip, CountByShipAndType, and CountByShipAndRank — power fleet-wide comparison widgets that break down metrics across vessels, categories, and crew ranks. See which ships have the most overdue maintenance items, compare incident rates by vessel type, or track certification compliance by crew rank across your entire fleet.
Multi-ship aggregations transform the dashboard from a simple status board into a fleet intelligence tool. Identify outlier vessels, spot trends across ship types, and benchmark performance — all from pre-built widgets that require zero custom report building.
- CountByShip breakdown widgets
- CountByShipAndType comparisons
- CountByShipAndRank analysis
- Fleet-wide benchmarking
- Outlier vessel identification
Newsfeed Integration

A real-time activity stream runs alongside your dashboard views, surfacing the latest operational events across your fleet. New maintenance completions, safety reports filed, certificate renewals, crew changes, and other significant events appear in chronological order — giving you a narrative view of fleet activity that complements the quantitative widget data.
The newsfeed provides context that raw numbers cannot. When a KPI widget shows a spike in deficiency counts, the newsfeed shows exactly which vessels reported issues and when.
The combination of quantitative dashboards and qualitative activity streams gives fleet managers both the "what" and the "why" in a single view.
- Real-time activity stream
- Chronological event feed
- Context alongside KPI numbers
- Cross-module event visibility
Control Panel Dashboards

Navatom administrators create and manage Control Panel dashboards — curated, standardized views distributed to all customer companies. These dashboards ensure that every fleet management company has access to best-practice KPI layouts from day one, without needing to build dashboards from scratch.
Control Panel dashboards come in two visibility levels: Private (visible only to the administrating entity) and Shared (distributed to all customer organizations). Shared Control Panel dashboards serve as templates and starting points — customers can use them as-is or copy them as a base for their own customized versions.
- Admin-curated standard views
- Distributed to all customers
- Private & Shared visibility levels
- Best-practice KPI layouts
- Copyable as customization base
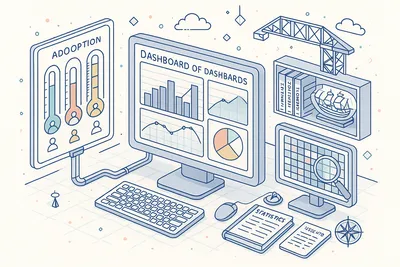
Dashboard & Analytics Overview

The Dashboard module itself provides a meta-level analytics view of dashboard usage and adoption across your organization. Track how many dashboards have been created, which widgets are most popular, and how frequently users engage with their dashboard views.
Usage analytics help fleet IT administrators and operations managers understand which KPIs their teams value most, identify under-utilized modules that may need training attention, and ensure that the dashboard investment translates into actual daily operational use across vessels and offices.
- Dashboard usage tracking
- Widget popularity metrics
- User engagement analytics
- Adoption insights for management
83 Pre-Built Widget Catalog

Access a library of 83 pre-built widgets covering 27+ integrated modules across your entire fleet operation. From PMS work order counts and inventory stock levels to safety incident tracking and financial summaries, every critical metric is available as a ready-to-use widget — no configuration or custom development required.
Widgets are organized by module: 8 for Planned Maintenance, 8 for Bookkeeping, 7 for Spare Parts, 6 each for Inventory Management, Deficiencies, Non-Conformities, Accidents, Near Misses, and Technical Findings, 5 each for Drydock, Forms, and Audits, 4 each for Certificates and Circulars, 3 for Manuals, 2 for Crew Manager, and 1 for Enquiries. Every module your fleet uses feeds directly into the dashboard.
- 83 widgets across 27+ modules
- PMS, Safety, Finance, Crew & more
- Zero-configuration setup
- Module-organized widget library
- Instant access to every fleet KPI
Three Widget Display Types

Every widget renders in one of three display types optimized for its data: Metric widgets show single-value KPIs with bold numbers and trend indicators — perfect for overdue counts, completion rates, and fleet totals. Table widgets present tabular data with sortable columns and pagination — ideal for listing open work orders, pending approvals, or expiring certificates.
Chart widgets visualize data as bar charts, line charts, pie charts, and other visual formats — turning raw numbers into actionable patterns. The three-type system ensures that every piece of fleet data is presented in the most effective format for quick comprehension and decision-making.
- Metric cards for single-value KPIs
- Table widgets for tabular data
- Chart widgets for visual analytics
- Automatic format selection per widget
Drag-and-Drop Dashboard Builder

Build your perfect dashboard layout with an intuitive drag-and-drop interface powered by react-grid-layout. Pick widgets from the catalog, drag them onto your dashboard canvas, and arrange them in any configuration.
Resize widgets by dragging corner handles to give more space to critical KPIs and compact secondary metrics.
The responsive layout engine automatically adapts to different screen sizes with configurable breakpoints. Dashboards built on a desktop monitor reflow intelligently on tablets and smaller screens.
Grid snapping ensures clean alignment, and collision detection prevents widget overlap — every layout looks professional without manual pixel-pushing.
- react-grid-layout powered canvas
- Drag, drop & resize widgets freely
- Responsive breakpoint adaptation
- Grid snapping & collision detection
- Clean layouts on any screen size
Custom Dashboard Creation

Create unlimited custom dashboards with full CRUD operations — create new dashboards, copy existing ones as a starting point, edit titles and descriptions, and delete dashboards you no longer need. Each dashboard is an independent canvas with its own widget selection, layout, and sharing settings.
Copy an existing dashboard to quickly spin up a variant — take a fleet superintendent's overview dashboard and adapt it for a port captain by swapping a few widgets. The copy operation preserves the full layout and widget configuration, saving setup time when creating role-specific views.
- Unlimited custom dashboards
- Full CRUD — create, copy, edit, delete
- Copy existing dashboards as templates
- Independent widget & layout per dashboard
Five Sharing & Visibility Levels

Control exactly who can see each dashboard with five sharing and visibility levels. User Private keeps a dashboard visible only to its creator.
User Shared lets you share with selected colleagues. User Public makes a dashboard visible to everyone in your company — ideal for fleet-wide KPI boards displayed on office monitors.
Control Panel Private and Control Panel Shared are administrator-managed levels for Navatom-curated dashboards distributed to customers. These levels enable fleet management companies to push standardized dashboards to all vessels and offices, ensuring consistent KPI monitoring across the organization without requiring each user to build their own views.
- User Private — creator-only access
- User Shared — selected colleagues
- User Public — company-wide visibility
- Control Panel Private & Shared
- Granular distribution control
Fleet & Vessel Scoping

Toggle between fleet-wide aggregate views and single-vessel detail views on any dashboard. Fleet scoping aggregates widget data across all vessels in your managed fleet — total overdue maintenance items, combined safety incident counts, fleet-wide certificate expiration summaries. Vessel scoping drills down to a single ship for focused operational review.
Ship-level filtering lets the Captain or Chief Engineer see only their vessel's data on the same dashboard layout that shore management uses for the full fleet. The same widgets, the same layout, the same KPI definitions — just scoped to the relevant context. Switch between fleet and vessel views instantly without rebuilding your dashboard.
- Fleet-wide aggregate view
- Single-vessel drill-down
- Instant scope toggle
- Same layout, different data context
- Captain-to-superintendent flexibility
Three Environment Contexts
Dashboards adapt to three operating environments: Company for shore-side fleet management, Ship for vessel-based crew access, and Third Party for external stakeholders like charterers, classification societies, or port state control interfaces. Each environment context determines which widgets are available and what data scope is applied.
Shore-side Company dashboards show fleet-wide aggregations, multi-ship comparisons, and management-level KPIs. Ship dashboards focus on the individual vessel's operational data — maintenance due, inventory levels, certificate status.
Third Party dashboards provide controlled external visibility into selected fleet metrics without exposing internal operational details.
- Company — shore-side management
- Ship — vessel crew access
- Third Party — external stakeholders
- Context-aware widget availability
Default Dashboard Selection

Set any dashboard as your default — the view that loads automatically when you open the Dashboard module. Each user can designate a different default dashboard per environment context, so your shore-side landing page differs from your vessel-side landing page. The default selection is personal and does not affect other users.
For new users or roles without a custom setup, administrators can assign Control Panel dashboards as organizational defaults. New crew members joining a vessel immediately see a curated, role-appropriate dashboard without any setup, reducing onboarding friction and ensuring immediate access to critical operational data.
- Per-user default dashboard
- Per-environment context defaults
- Admin-assigned organizational defaults
- Zero-setup onboarding for new users
Module-Specific Widget Controllers

27 dedicated widget controllers — one per integrated module — handle data retrieval, aggregation, and formatting for every widget in the catalog. Each controller understands the domain model of its module: the PMS controller knows about work order statuses and maintenance intervals, the Safety controller knows about incident categories and severity levels, the Finance controller knows about budget periods and cost centers.
This modular architecture means widget data is always accurate and domain-aware. Controllers apply the correct business logic, status mappings, and aggregation rules for their module.
When a module adds new features or data fields, its widget controller extends naturally without affecting the rest of the dashboard system.
- 27 dedicated controllers
- One controller per integrated module
- Domain-aware data retrieval
- Correct business logic per module
- Extensible as modules grow
Real-Time Data Aggregation

Widget handlers query live MongoDB data with every dashboard load, ensuring you always see current operational status — not stale cached reports. When a maintenance work order is completed, an incident is reported, or a certificate expires, the dashboard reflects the change immediately.
Permission-aware data pipelines ensure users only see data they are authorized to access. Widget handlers enforce the same role-based access controls as the underlying modules — a Chief Engineer sees maintenance and technical data, while a DPA sees safety and compliance metrics. The dashboard never exposes data beyond a user's module-level permissions.
- Live MongoDB queries on every load
- No stale cached reports
- Immediate change reflection
- Permission-aware data pipelines
- Role-based access enforcement
Multi-Ship Count Aggregations

Specialized DTOs — CountByShip, CountByShipAndType, and CountByShipAndRank — power fleet-wide comparison widgets that break down metrics across vessels, categories, and crew ranks. See which ships have the most overdue maintenance items, compare incident rates by vessel type, or track certification compliance by crew rank across your entire fleet.
Multi-ship aggregations transform the dashboard from a simple status board into a fleet intelligence tool. Identify outlier vessels, spot trends across ship types, and benchmark performance — all from pre-built widgets that require zero custom report building.
- CountByShip breakdown widgets
- CountByShipAndType comparisons
- CountByShipAndRank analysis
- Fleet-wide benchmarking
- Outlier vessel identification
Newsfeed Integration

A real-time activity stream runs alongside your dashboard views, surfacing the latest operational events across your fleet. New maintenance completions, safety reports filed, certificate renewals, crew changes, and other significant events appear in chronological order — giving you a narrative view of fleet activity that complements the quantitative widget data.
The newsfeed provides context that raw numbers cannot. When a KPI widget shows a spike in deficiency counts, the newsfeed shows exactly which vessels reported issues and when.
The combination of quantitative dashboards and qualitative activity streams gives fleet managers both the "what" and the "why" in a single view.
- Real-time activity stream
- Chronological event feed
- Context alongside KPI numbers
- Cross-module event visibility
Control Panel Dashboards

Navatom administrators create and manage Control Panel dashboards — curated, standardized views distributed to all customer companies. These dashboards ensure that every fleet management company has access to best-practice KPI layouts from day one, without needing to build dashboards from scratch.
Control Panel dashboards come in two visibility levels: Private (visible only to the administrating entity) and Shared (distributed to all customer organizations). Shared Control Panel dashboards serve as templates and starting points — customers can use them as-is or copy them as a base for their own customized versions.
- Admin-curated standard views
- Distributed to all customers
- Private & Shared visibility levels
- Best-practice KPI layouts
- Copyable as customization base
Dashboard & Analytics Overview
The Dashboard module itself provides a meta-level analytics view of dashboard usage and adoption across your organization. Track how many dashboards have been created, which widgets are most popular, and how frequently users engage with their dashboard views.
Usage analytics help fleet IT administrators and operations managers understand which KPIs their teams value most, identify under-utilized modules that may need training attention, and ensure that the dashboard investment translates into actual daily operational use across vessels and offices.
- Dashboard usage tracking
- Widget popularity metrics
- User engagement analytics
- Adoption insights for management
Technical
Under the Hood
Architecture and engineering behind Dashboard — data handling, real-time sync, and interface design.
React-Grid-Layout Responsive Dashboard Engine
Dashboards are powered by react-grid-layout with configurable responsive breakpoints, drag-and-drop positioning, resize handles, collision detection, and grid snapping. Layouts persist per user and automatically reflow across screen sizes — from large office monitors to vessel bridge tablets.
83-Widget Polymorphic Rendering System
Each of the 83 widgets dynamically renders as one of three display types — Metric, Table, or Chart — based on the DashboardWidgetType enum. The polymorphic rendering engine selects the appropriate visualization component, data formatter, and interaction behavior at runtime without widget-specific code branches.
27-Controller Module Aggregation Architecture
27 dedicated widget controllers — one per integrated module — encapsulate domain-specific query logic, status mappings, and aggregation rules. Each controller implements a standardized interface, enabling the dashboard to treat all modules uniformly while respecting the unique data model of each.
Permission-Aware Widget Data Pipeline
Widget handlers enforce role-based access controls at the data layer, ensuring users see only the metrics they are authorized to access. Permission checks cascade from user role through module access to specific data scope — the same access rules that govern the underlying modules apply automatically to every dashboard widget.
Multi-Ship Real-Time Aggregation Engine
Specialized aggregation DTOs (CountByShip, CountByShipAndType, CountByShipAndRank) and ~236 widget handler classes query live MongoDB data for fleet-wide comparisons. The engine supports real-time cross-vessel breakdowns without pre-computed data warehousing or scheduled batch jobs.
Shareable Dashboard Framework with 5 Visibility Levels
The DashboardShareStatus enum governs five visibility levels — USER_PRIVATE, USER_SHARED, USER_PUBLIC, CONTROL_PANEL_PRIVATE, CONTROL_PANEL_SHARED — enabling personal, team, company-wide, and platform-level dashboard distribution with granular access control.
Solutions
Explore Solutions
Compliance and operational solutions powered by Dashboard.
CII & EEXI Compliance
Navatom provides real-time Carbon Intensity Indicator monitoring, EEXI baseline management, and SEEMP integration to help ship managers maintain favorable efficiency ratings and avoid corrective action requirements.
Maritime Data Integrity & Retention
Navatom has never lost customer data. Years of maintenance records, voyage reports, crew documents, and compliance evidence — stored indefinitely, accessible instantly, and preserved with complete integrity.
EU MRV Reporting
Navatom automates EU MRV emissions monitoring, reporting, and verification for ships calling at EU/EEA ports, ensuring full compliance with Regulation (EU) 2015/757 and its 2023 amendments.
Fleet Scalability & Rapid Onboarding
Add vessels to Navatom in minutes, not months. As a maritime cloud platform, Navatom requires no installation, no infrastructure scaling, and no IT projects — whether you are onboarding your second vessel or your two-hundredth.
FuelEU Maritime Compliance
Navatom helps ship operators meet FuelEU Maritime requirements by tracking well-to-wake GHG intensity, monitoring compliance balances, and supporting fleet pooling strategies under Regulation (EU) 2023/1805.
IMO DCS Reporting
Navatom automates IMO Data Collection System reporting by capturing fuel consumption, distance, and hours underway from daily operations and generating flag state submissions in compliance with MARPOL Annex VI Regulation 22A.
Ship Management for Large Fleets
Navatom is an integrated ship management platform that manages large fleets with the same ease as small ones — 30+ modules, instant vessel onboarding, years of operational data retained without performance loss, and a zero data loss track record since launch.
Ship Management for Small Fleets
Navatom gives small fleet operators access to the same 30+ integrated ship management modules used by large fleets — with no installation, per-ship pricing, and the ability to start from just one vessel.
Ready to try Dashboard?
Start your free trial today and see how Dashboard fits into your fleet operations.