Fleet Size
Need
Vessel Type
Migration
About Us

Create
Tailor-made analytics
People have different pov, you define the analytics according to what you want to achieve
Customize the analytics according to your company needs
Complicated data on easy to read charts
Complicated datas for analytics turn into a very simple graphic view
Do not grapple with complicated data or values. Use the understandable charts of Navatom
Deep analytics with any value needs to be followed
Any value on the Navatom can be used for analytics
If you need to follow some values Navatom can show you that values as graphics

Analyze
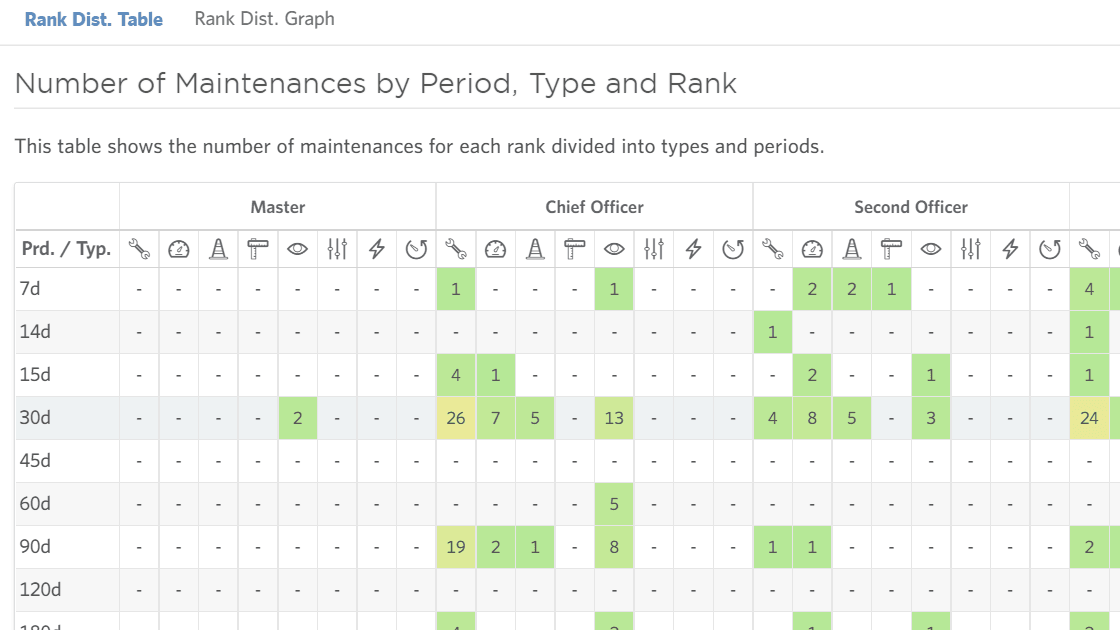
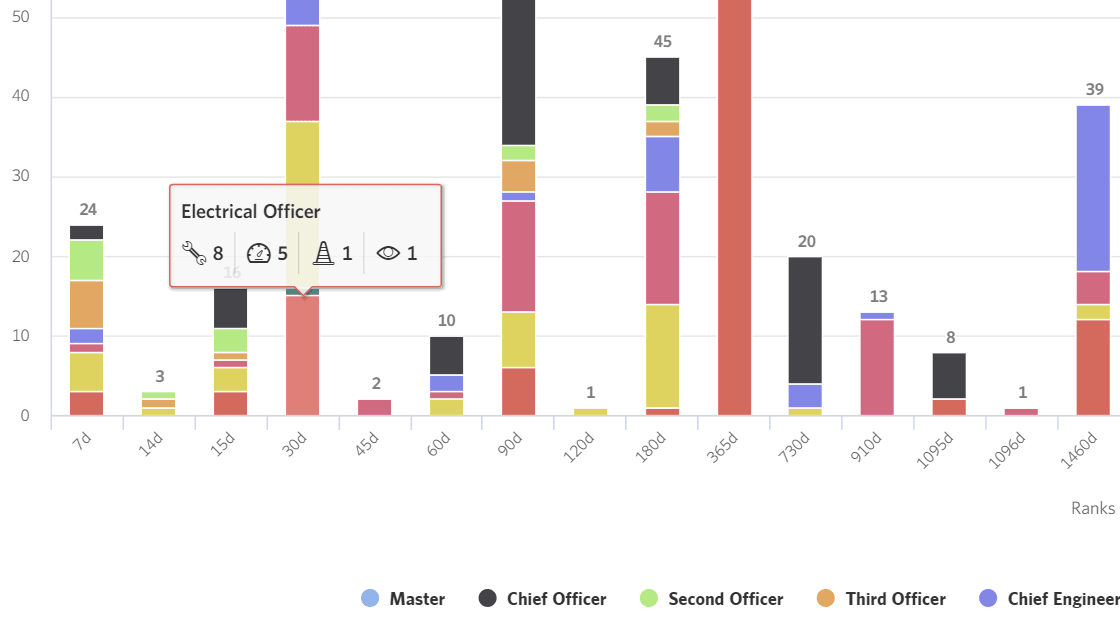
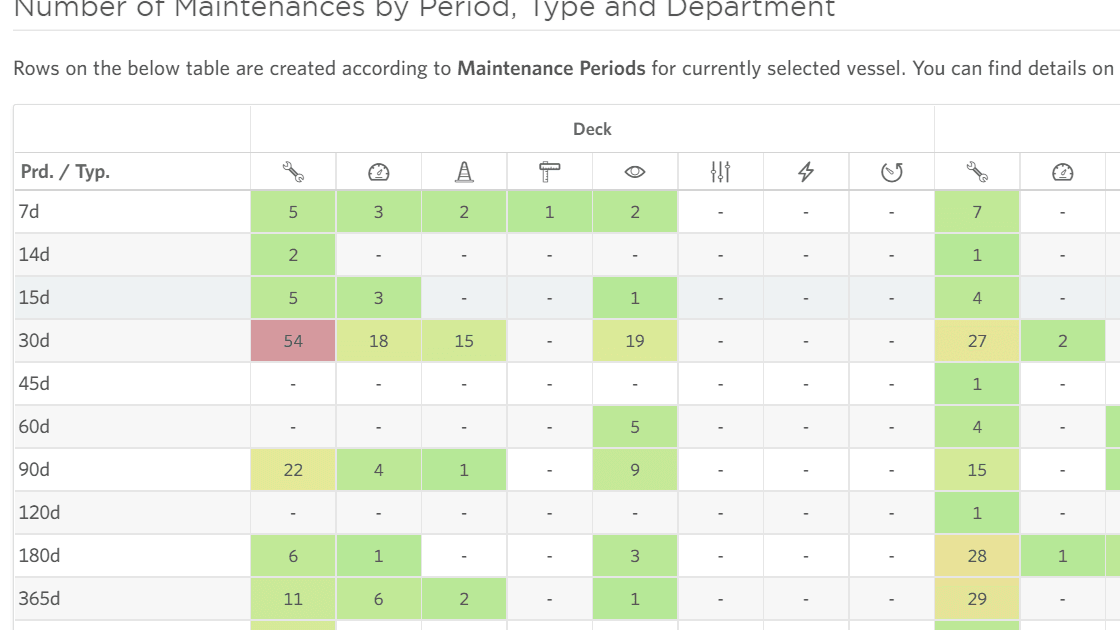
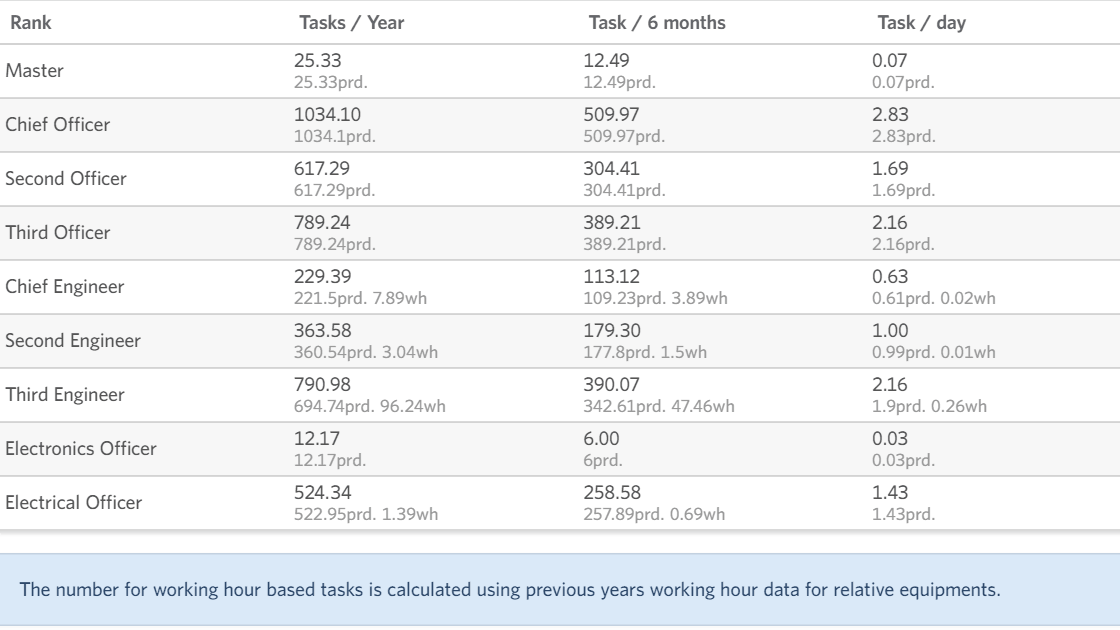
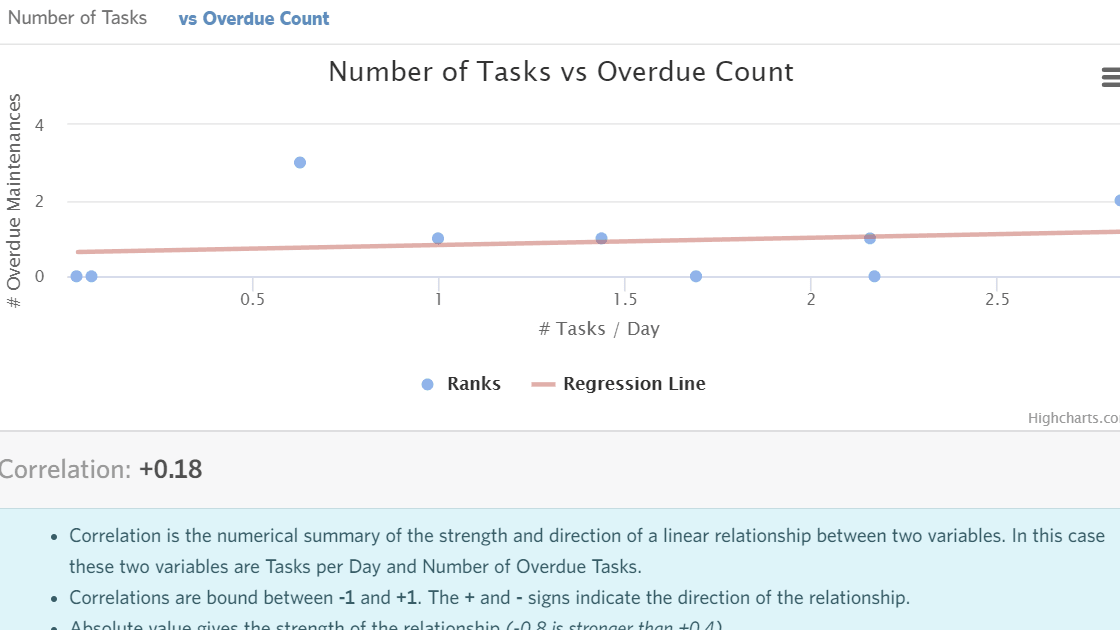
Crew PMS Task Distribution
Various tables and graphics visualizing the amount and period of tasks given to crew members.
Reduce overdues by improving and distributing PMS tasks.
Visualize task count / overdue correlation.
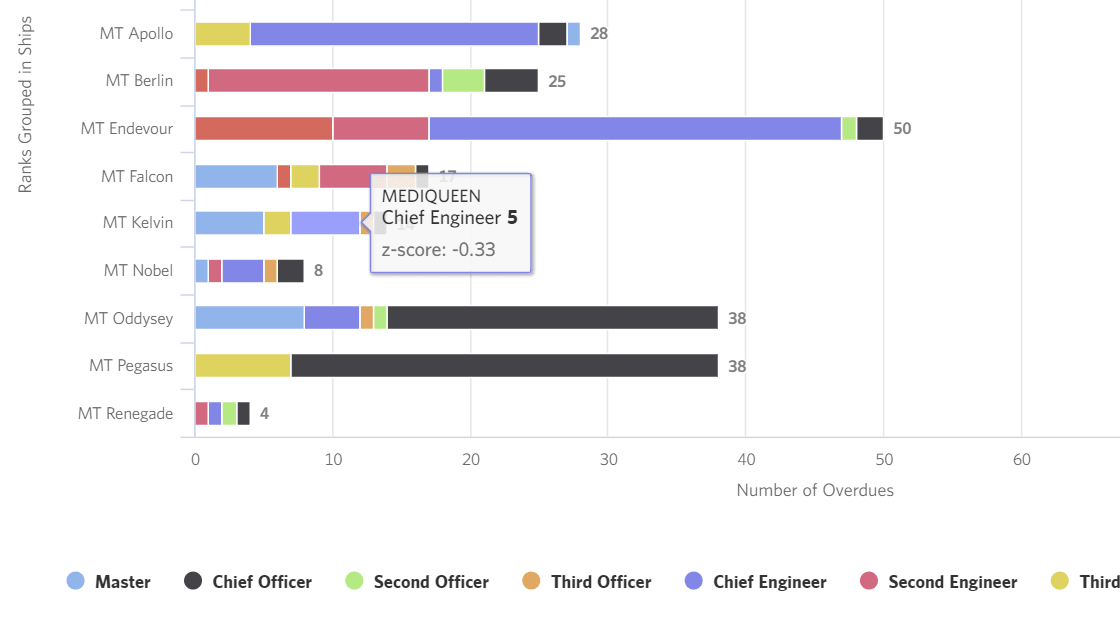
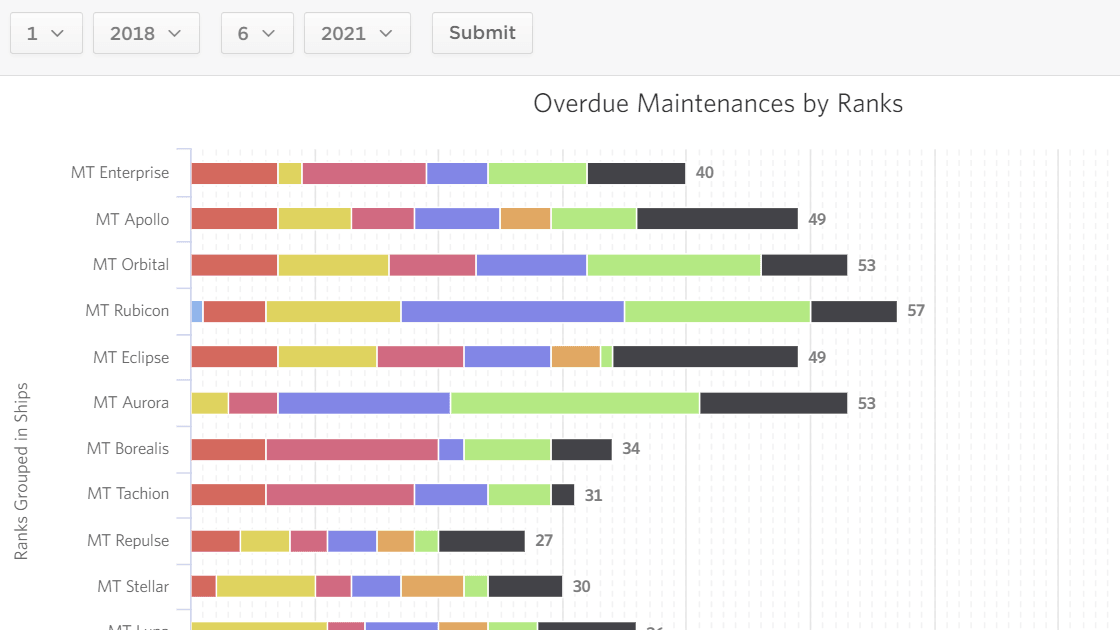
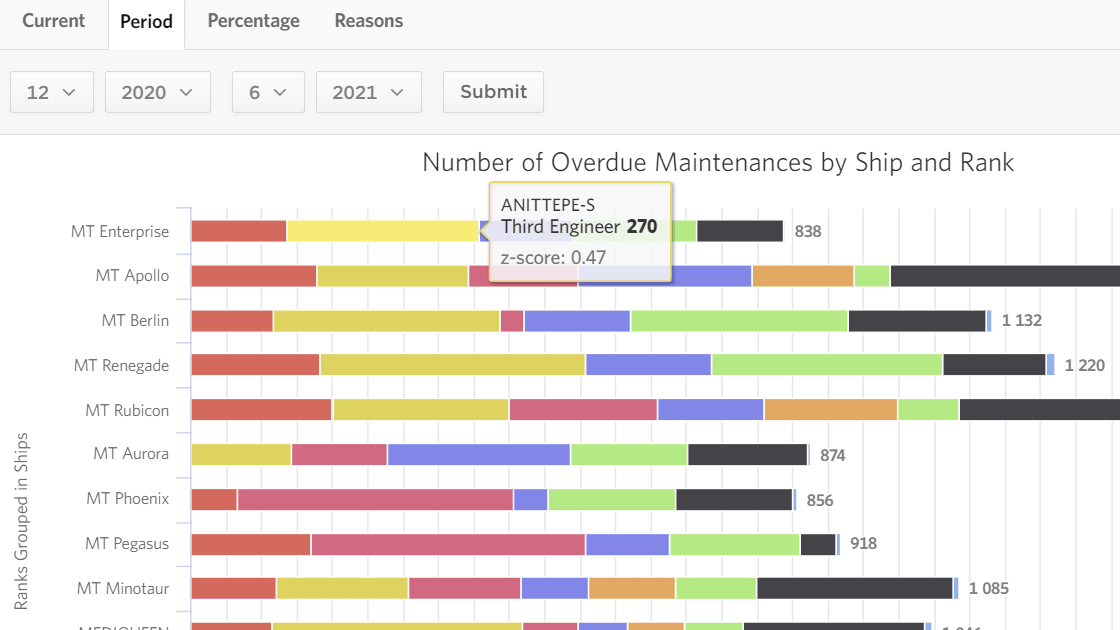
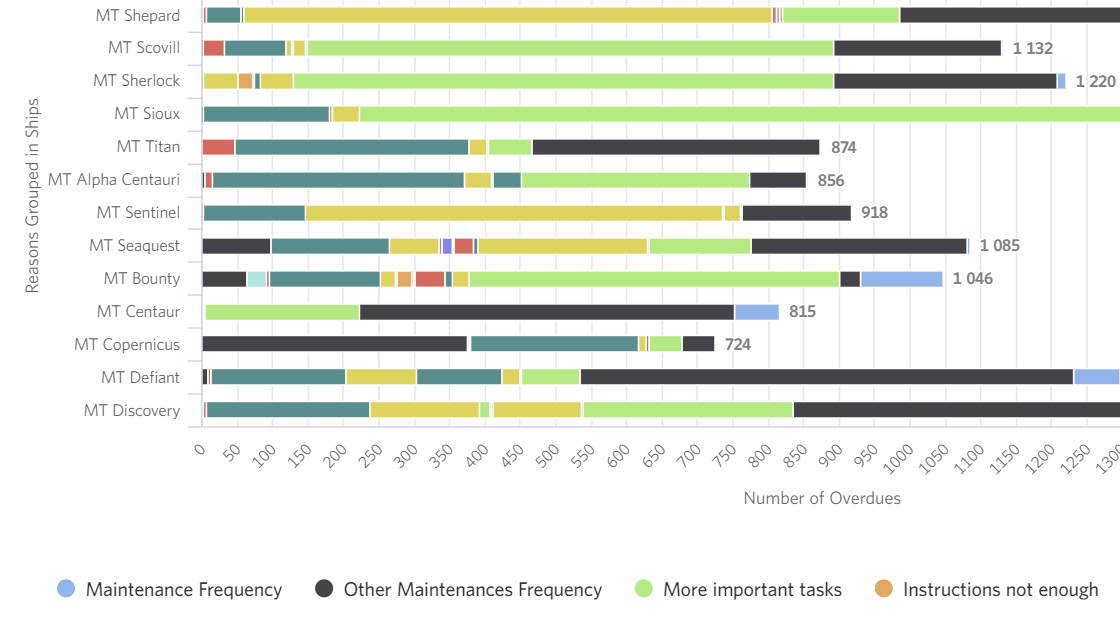
Overdue Analysis
Analyze current and past overdue tasks within your fleet, and see reasons for overdue completion.
Improve PMS scheduling by seeing exactly what causes overdue tasks.
Visualize running cost spending per category in a period
Search through a category and its children, and visualize spending within the selected period.
Copyright © 2021 Navatom - Hive, All rights reserved. Various trademarks held by their respective owners.